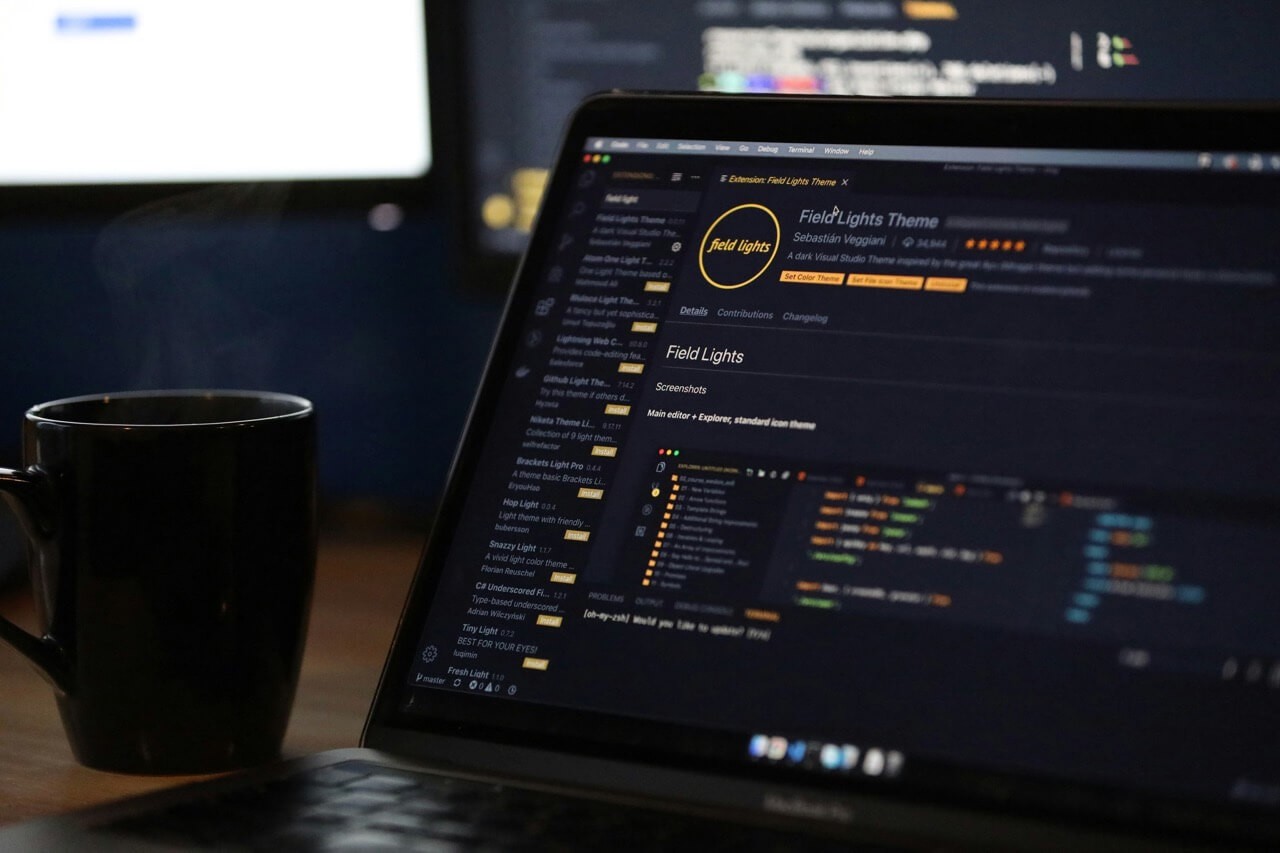
Debugging is an essential part of the development process, and Framer provides several tools to help you identify and resolve issues efficiently. This guide covers best practices for debugging Framer projects, ensuring your prototypes run smoothly and as intended.
Start by using Framer’s built-in debugging tools, such as the console and inspector. The console allows you to log messages, errors, and warnings, helping you track down issues in your code. The inspector lets you examine elements in your prototype, view their properties, and make real-time adjustments, making it easier to identify and fix problems.
Another important practice is to write clean, modular code. Break your code into smaller, reusable functions and components. This not only makes your code easier to read and maintain but also simplifies the debugging process. When an issue arises, you can quickly isolate the problematic code and address it without affecting other parts of your project.
Finally, test your prototype thoroughly across different devices and browsers. Framer’s preview and share features allow you to test your design in various environments, ensuring consistent performance and user experience. By following these best practices, you can streamline the debugging process and deliver high-quality Framer projects.
Category
Development
Date
July 28, 2024
Tags
Debugging, Framer Development


